Wishlist


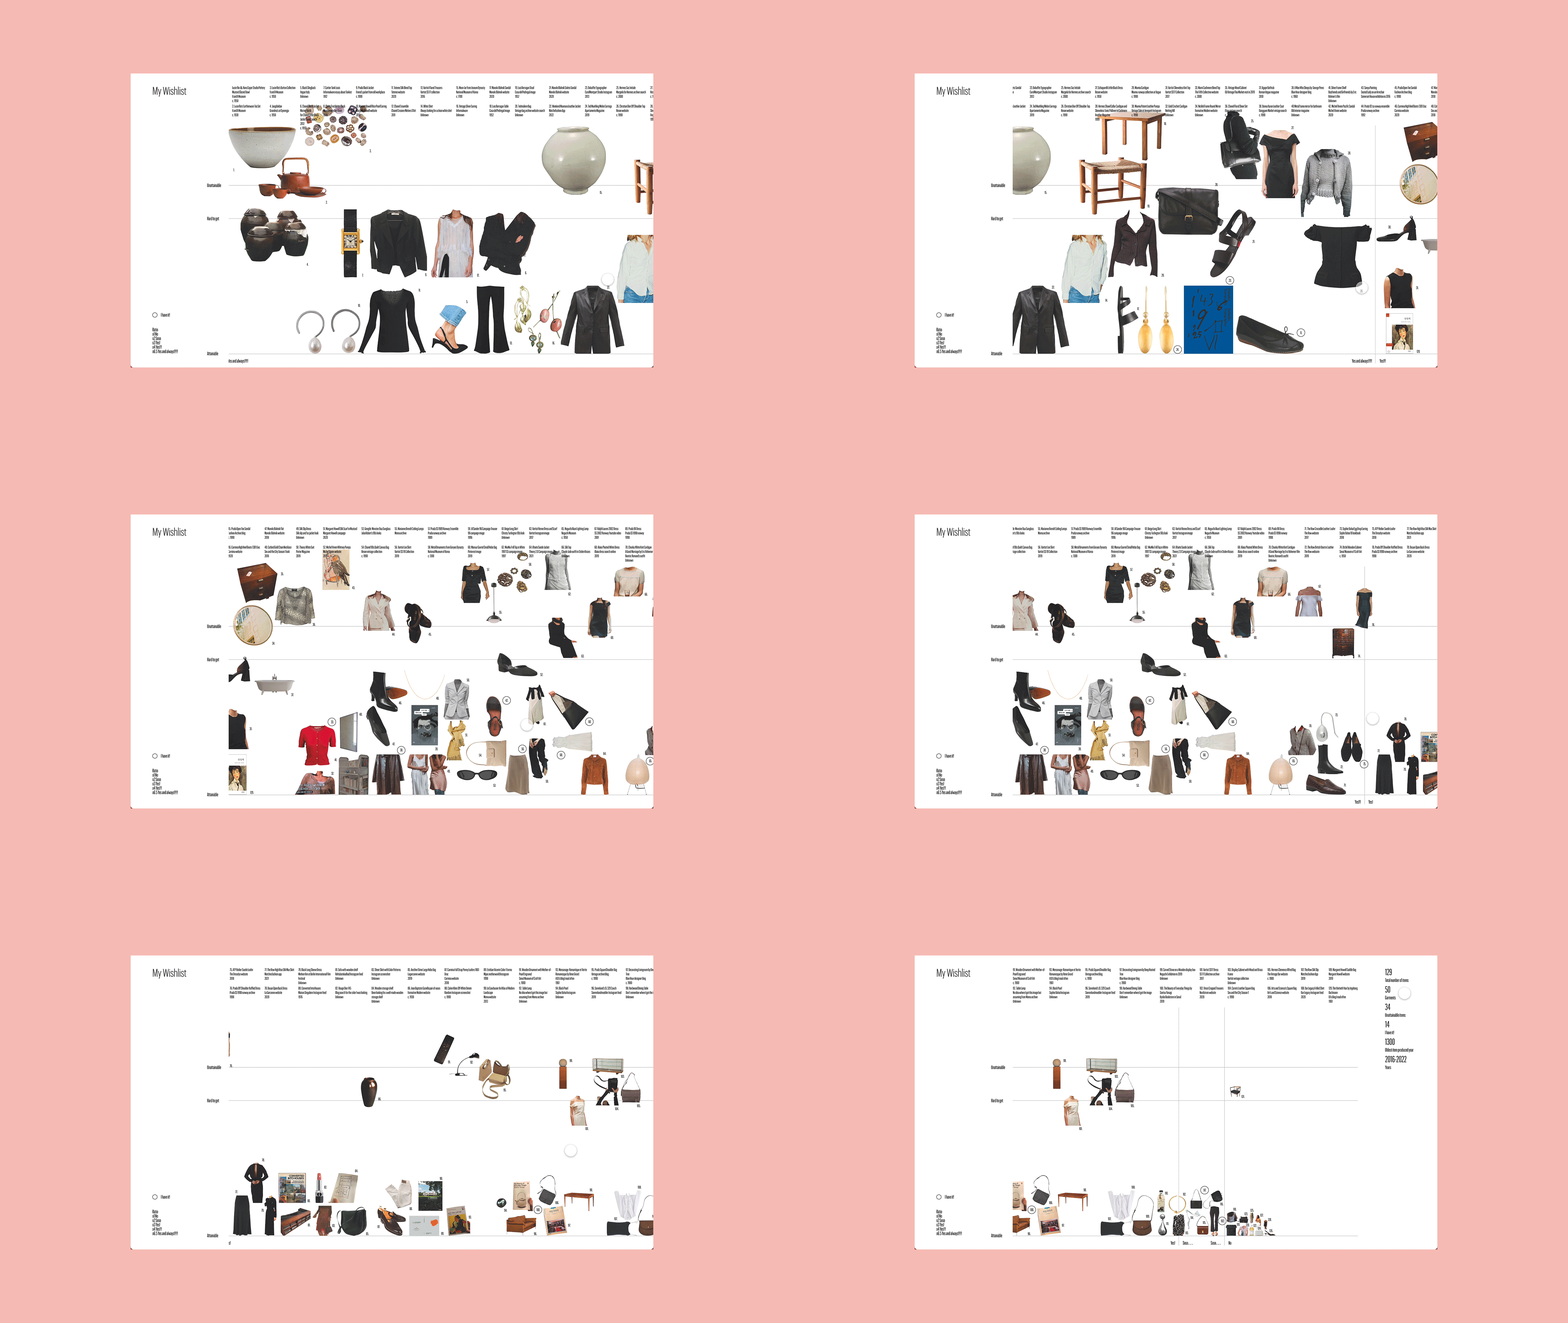
Infographic of my wishlist items. The two most significant elements in this diagram are availability and desireness. There are repeated items that I constantly want and also items that are literally wishlist as they are unattainable. Designed it to be like a picture dictionary. The horizontally long format emphasizes the quantity and timeline journey. The bigger an item is, the more I want and the higher it is positioned, the harder it is to obtain.
Oct 2022
Infographic
Student Work
Mentor: Shiva Nellaperumal
Oct 2022
Infographic
Student Work
Mentor: Shiva Nellaperumal